The purpose of this article is to assess the impact of the latest TIC result on the US$ and how government and trade policies influence the dollar supply and its relative value to other currencies.
Most people would ask: What is TIC?
TIC is Treasury International Capital. According to Investopedia:
TIC is a select group of capital monitored with regard to its international movement. Treasury International Capital is a useful economic indicator that tracks the flow of Treasury and agency securities as well as corporate bonds and equities into and out of the United States. TIC data is important to investors, especially with the increasing amount of foreign participation in the U.S. financial markets.
So what does it mean when TIC moves up or down?
As demand for U.S. financial instruments increases, the value of the dollar is held up.
The chart below shows the monthly movement of TIC with the addition of the latest figures:
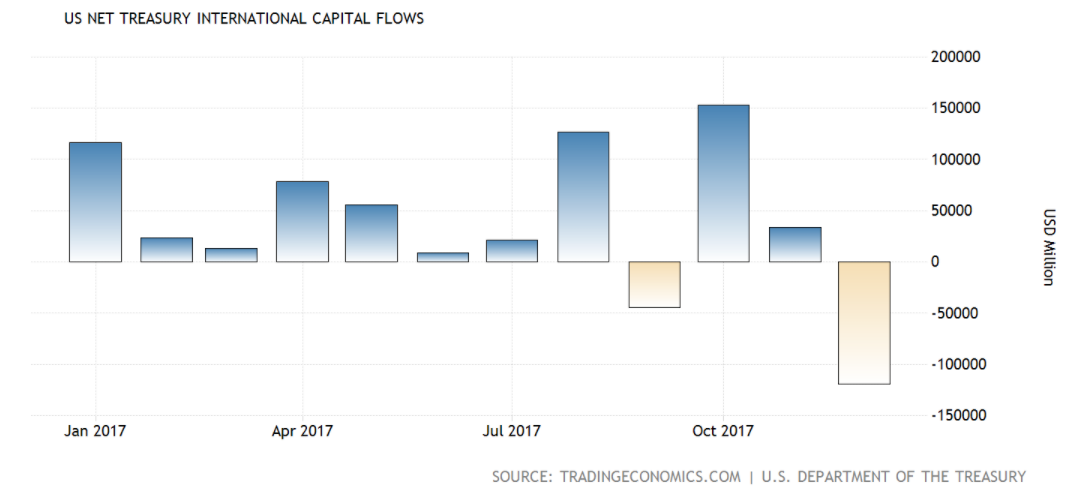
Overseas investors sold USD 119.3 billion of US assets, including short-dated instruments in December of 2017. This creates short-term downward pressure on the dollar.
So why is this important now?
I find that large changes ($100B+) in TIC give a one month’s advanced warning of a movement in the dollar. The latest move signals weakness in what is now an established bear market for the dollar.

The dollar has risen through September 2017, and the corresponding TIC results have been positive in the same period. When one compares the TIC movement bars on the bar chart above in the previous section, with the USD line chart, one can see how the dollar rises and falls with positive and negative TIC movements. Blue bars up = dollar up; yellow bars down = dollar down.
While monthly TIC movements cause minor upward and downward movements that might be traded, the macro direction is now down due to the “twin deficits” phenomena I identified in this recent article on the dollar.
Long-Term Picture
The very long-term TIC picture is not as decisive as it once was as the chart below shows:
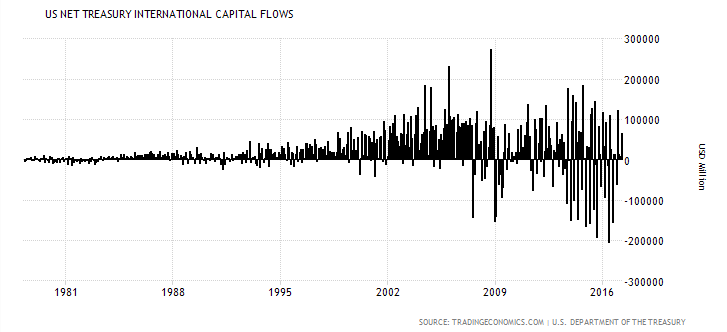
Since the 2007-09 GFC, capital flows are not as one-sided as they once were.
America is a net exporter of dollars as the chart below shows:
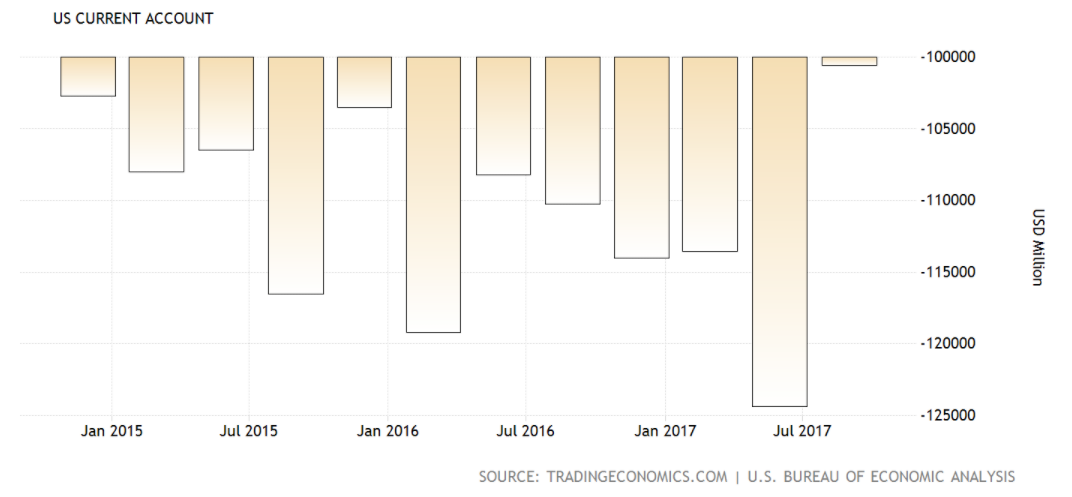
America imports goods and services and exports dollars. The exported dollars add to the stocks of foreign reserves held by other countries. This stock of overseas dollars allows the dollar to be used as the world reserve currency.
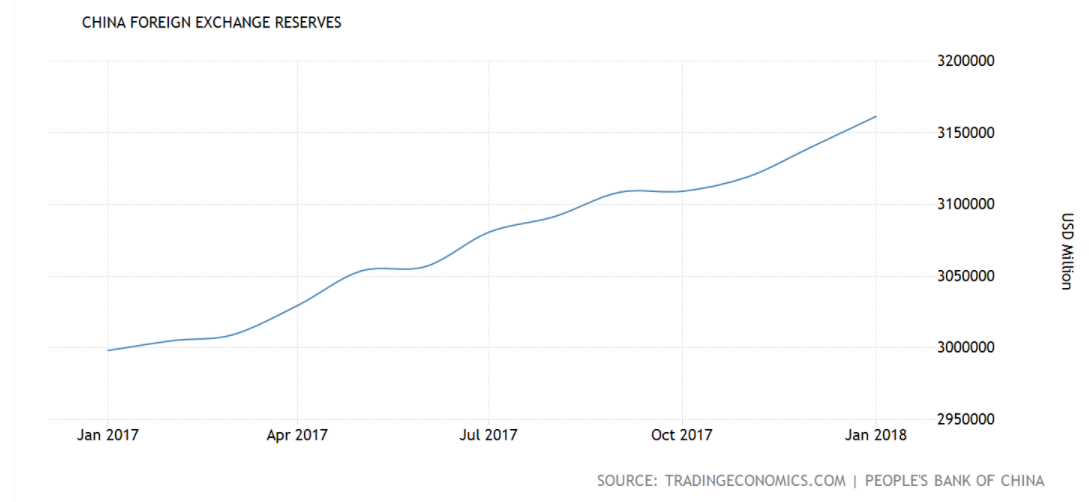
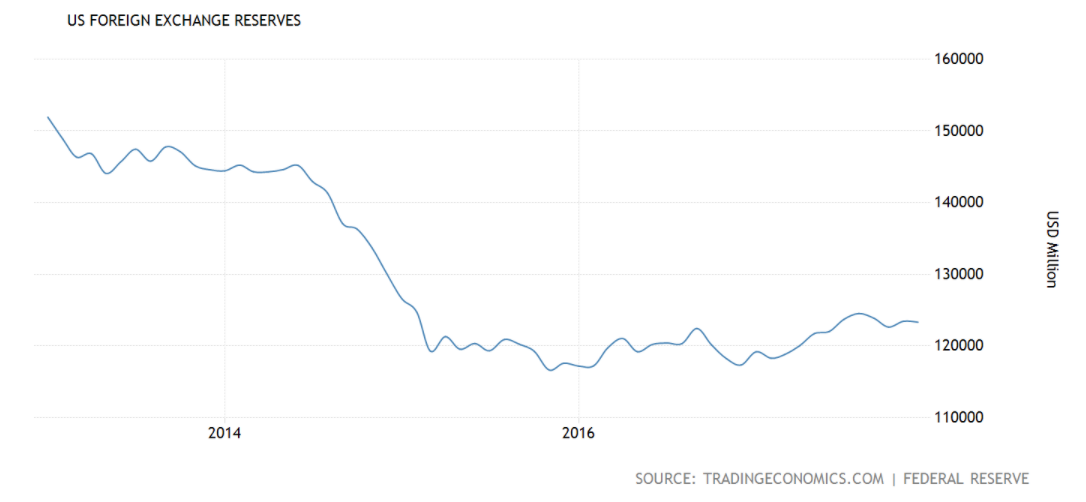
One can see from the chart below that while America’s foreign currency reserves have been flat, China’s have been rising. China is our biggest trading partner by far. China’s stock of foreign currency reserves is fully on order of magnitude larger than America’s. $3.15T v $120B.
What would one rather have?
- Imports of real goods and services for dollar credits, meaning lower inflation, lower taxes, and lower unemployment; or
- exports of real goods and services, meaning higher inflation, higher taxes, and higher unemployment.
The former is the wiser choice and the one we have. The dollar cannot be the world reserve currency if there is not a large stock of dollars overseas for others to use. As the issuer of the world reserve currency, America enjoys qualitative benefits in foreign policy that other countries do not have.
The chart below shows the longer-term dollar trend:
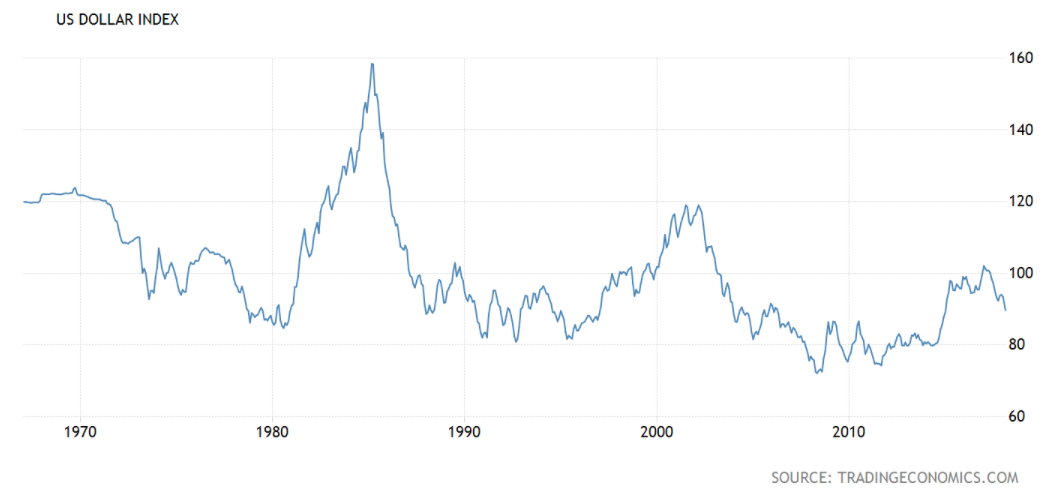
The graph shows that from 1970 to the present the macro trend is downwards as ever more dollars are created and added to the stock of dollar holdings.
Money is destroyed in the following ways:
1. When commercial bank loans are repaid, the loan balance falls to zero and those credit money dollars cease to exist.
2. When the government runs a surplus budget and taxes dollars out of the economy, they cease to exist and appear in no measure of any money stock such as M1, M2 or M3. This then leads to the logical conclusion that taxes do not pay for anything.
The charts below show long-term dollar creation in action:
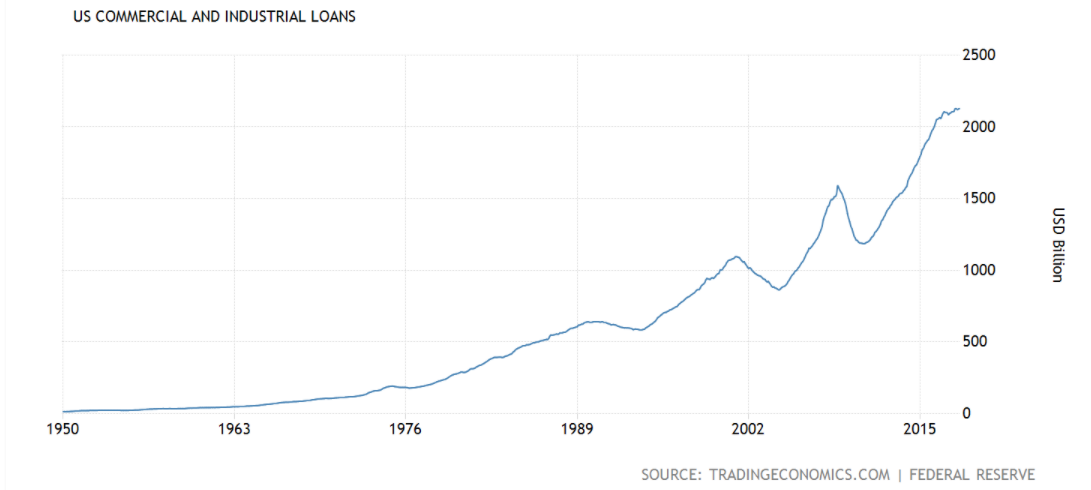
The chart above shows credit money creation by commercial banks. Over $20T added to the stock of dollars since 1950.
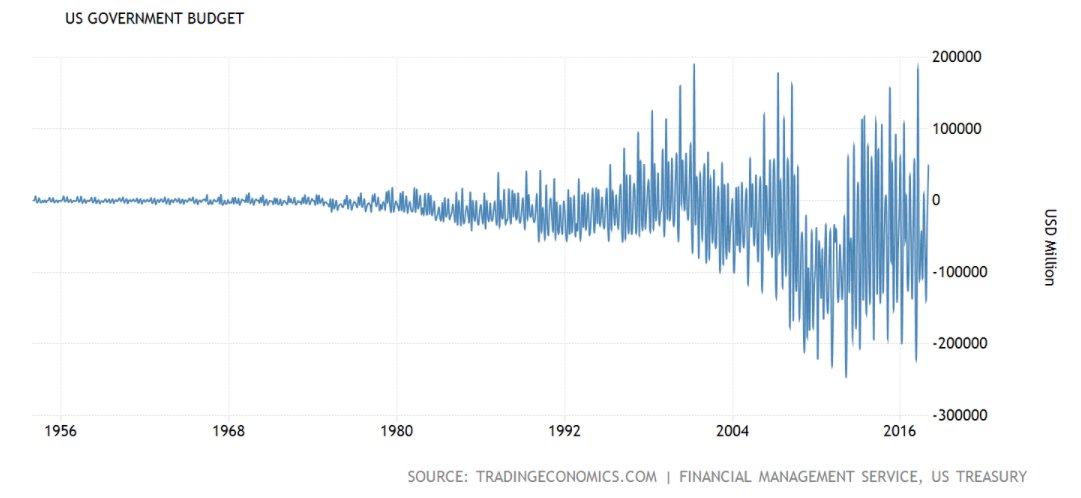
The chart above shows the government budget. The chart shows a net creation of dollars from deficit budgets and Fed monetary rate targeting operations. When the government runs a deficit budget, it is required by law to match the spending by accepting Treasury deposits, and the chart below shows how this stock of national savings has built up. This process is discussed in this article.
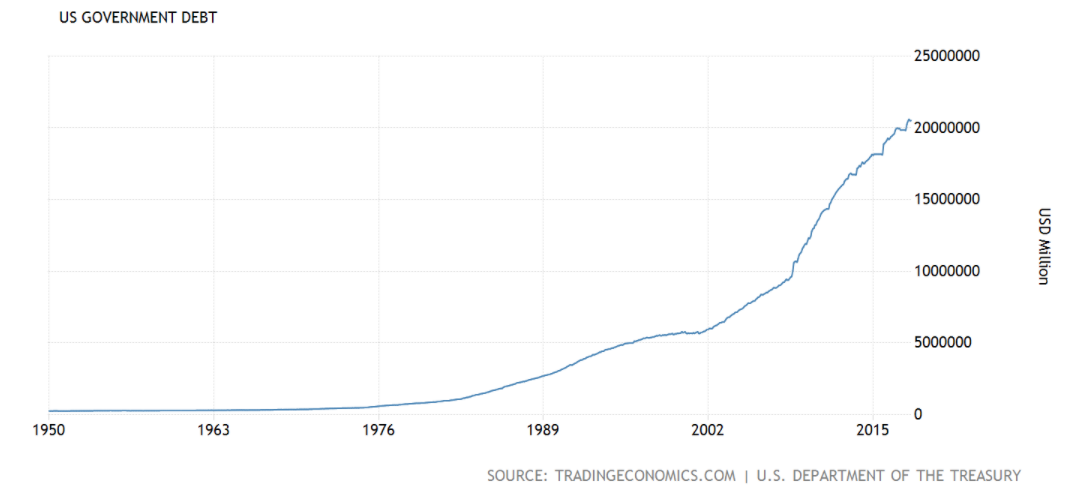
The chart above shows that the government deficit has been matched by over $20T of Treasury deposits and Fed monetary operations.
The chart below shows the current account over the same time period.
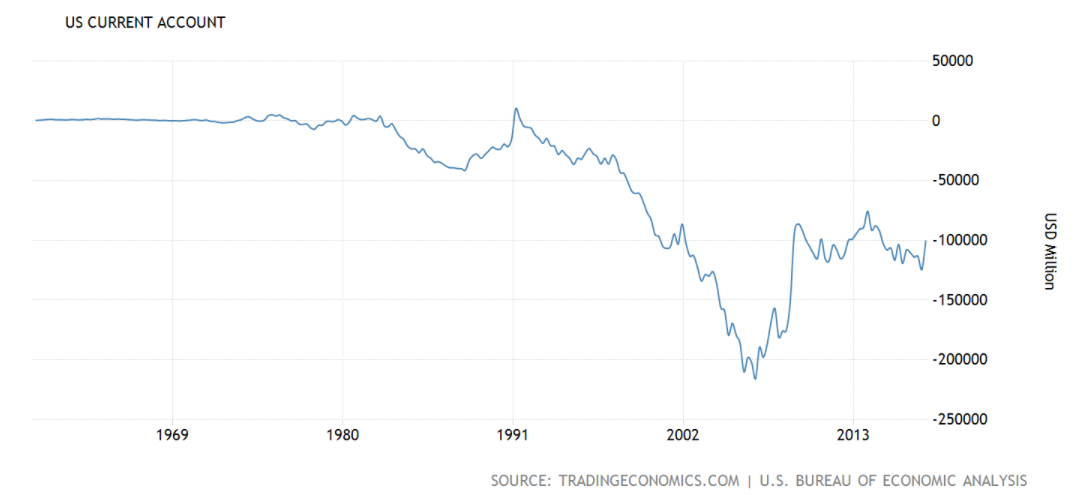
The chart above shows that there has been a net outflow of dollars into the external sector. These dollars are held as a stock in other countries and would flow back to America if we were to export more goods and services than we imported.
The table below from the IMF shows the stock of dollars held overseas.
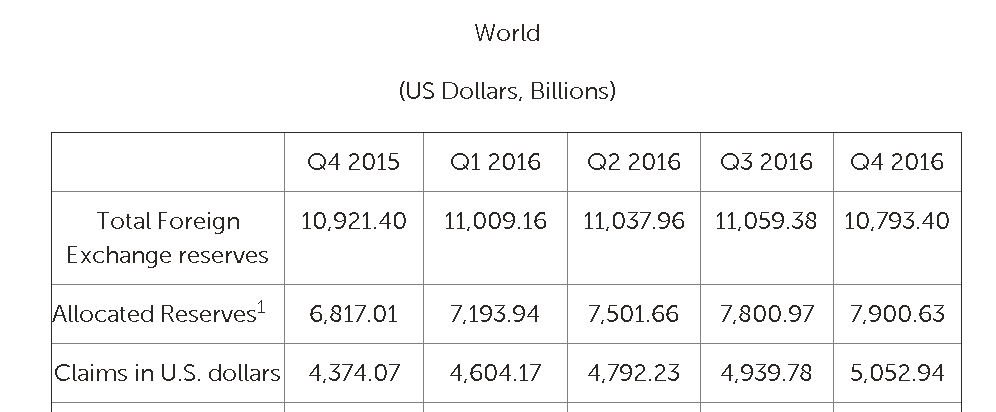
The table shows that over $5T is parked overseas.
When one looks at the dollar supply, it is clear that it is large and growing.
1. $20T from private credit creation held as private debt.
2. $20T held as Treasury deposits that matched government deficit spending and Fed monetary operations.
3. $5T exported overseas on the current account.
All three sources still growing, especially given the recent expansionary government budgets discussed in this article.
Since 1970, the dollar appears to move between a value of 80 to 160 on its multi-decade journey downwards. At present, we are moving into the phase of the “twin deficits” which sees the supply of dollars accelerate overall and its relative value fall. When the twin deficits reverse through government surplus budgets, credit contraction or a current account surplus, or a combination of all three, the dollar will peak again as it did in the mid-1980s and the turn of the century dot-com boom-bust. This is discussed in this article.
What other countries are doing also affects the dollar
The largest component of the dollar-weighted index is the euro. The supply of the euro is decelerating at present due to government austerity policies and net exports removing euros from international currency holdings in return for European goods and services. This is discussed in this article.
These foreign government and trade policies accelerate the downward dollar trend in a relative sense.
Recommendation Summary and Conclusion
The very long-term prospect for the dollar is downwards as more dollars are added to the supply. This has been going on since at least 1970 and reinforces the role of the dollar as the world reserve currency.
In the medium term, the dollar will continue to fall in line with the “twin deficits” whereby dollar creation is accelerated while this phenomenon takes place.
For the moment, rallies in the dollar should be sold, so when TIC spikes and the dollar rallies a little, like last month, the rally can be sold given the net outflow overall.
In the longer medium term, once government and trade policies have reversed, falls in the dollar can be bought in the knowledge that the dollar is appreciating overall given the supply of dollars is decreasing or at least decelerating. The actions of other governments, such as in the EU, can accelerate this process, as they are doing now, with policies that work in the other direction. I would estimate the dollar will fall for the next few years and reverse direction at the end of the decade in line with government spending and trade balances.
Investors wishing to trade movements in the dollar can do using the following ETF stocks.
| UUP | PowerShares DB US Dollar Bullish Fund |
| USDU | WisdomTree Bloomberg U.S. Dollar Bullish |
| UDN | PowerShares DB US Dollar Bearish Fund |
Disclosure: I/we have no positions in any stocks mentioned, but may initiate a short position in UUP over the next 72 hours.
I wrote this article myself, and it expresses my own opinions. I am not receiving compensation for it (other than from Seeking Alpha). I have no business relationship with any company whose stock is mentioned in this article.
